Master email marketing analytics with actionable best practices. Track performance metrics, optimize campaigns, and improve ROI with proven strategies.
Master email marketing analytics with actionable best practices. Track performance metrics, optimize campaigns, and improve ROI with proven strategies.
Most of the data I need is now collected. Let me write the full blog post.
Most email marketing teams track open rates religiously but optimize nothing else. That disconnect is exactly why so many campaigns plateau. The real performance gains come from treating your data as a feedback loop, not a scorecard. These email marketing analytics best practices will show you which metrics actually matter, how to read them correctly, and how to turn every campaign into an insight that improves the next one.
Key Takeaways
Email marketing campaigns deliver an average ROI of 36 times your investment, meaning businesses earn $36 for every dollar spent. But that number is only achievable if you measure and act on the right metrics.
Apple Mail accounts for roughly 46% of email clients, and its Mail Privacy Protection (MPP) has significantly skewed open rate data upward. As a result, email marketers now prioritize click-through rates, click-to-open rates, and conversion metrics over open rates when evaluating campaign performance.
According to DMA, marketers have found a 760% increase in email revenue from segmented campaigns. Analytics only helps you realize that gain if you know which segments to build.
Automations accounted for just 2% of email sends but drove 30% of revenue, earning 16 times more per send than scheduled campaigns. Measuring automation performance separately from broadcast campaigns is essential.
Email performance analysis should happen at multiple intervals: daily monitoring for delivery and bounce rates to catch immediate issues, weekly reviews of campaign performance and engagement metrics, and monthly deep-dives into customer lifecycle metrics and overall strategy effectiveness.
The Core Metrics of Email Marketing Performance
Not every number in your dashboard deserves equal attention. Focus on the metrics that connect directly to campaign goals and business outcomes.
Open rate tells you whether your subject line and sender name earned a click. The average email open rate in 2025 was 43.46%, a slight increase on 2024's average of 42.35%. However, treat this number with caution. Apple Mail Privacy Protection now affects roughly 50 to 60% of recorded email opens, inflating open rate data and making it a less reliable engagement metric. As a result, many marketers now rely more heavily on clicks, replies, and conversions when evaluating campaign performance.
Click-through rate (CTR) measures the percentage of delivered emails that received at least one link click. In 2024, the average marketing email click-through rate was 2.62%. CTR measures overall campaign effectiveness by combining deliverability and content performance. According to 2025 data, anything above 2% is considered strong across most industries, with industry averages typically ranging from 1.3 to 2.7%.
Click-to-open rate (CTOR) is more precise. CTOR shows the percentage of people who open your email who also click on it. It is a useful metric because it can show how engaging your email content is. A low open rate with a high CTOR suggests that the people who open your emails find the content relevant. A good CTOR typically ranges between 20 and 30%, with 25 to 30% representing excellent performance.
Conversion rate ties email activity to business outcomes. The average conversion rate across all industries is 0.08%, with top 10% performers reaching 0.44%, five times higher.
Bounce rate signals list health. In 2024, the average bounce rate across all industries was 2.33%. A bounce rate below 2% is generally considered acceptable, and under 1% is ideal.
Unsubscribe rate reflects how well your content matches subscriber expectations. The average unsubscribe rate in 2025 was 0.22%. A spike here is often an early warning sign of frequency problems or mismatched content, not a deliverability issue.
Why Open Rate Is No Longer Your Primary KPI
Open rate was once the headline number for email marketing campaign analysis. That has changed.
Apple's Mail Privacy Protection automatically preloads email content and images for Apple Mail users, even if they never actually open the email. This means a significant portion of your reported opens never represented a human viewing your email.
Open rates have become less reliable with 64% of Apple Mail users on MPP, which pre-loads images and inflates metrics. Smart marketers now emphasize click-through rates, conversion rates, and revenue per email as primary KPIs. Consider open rates directionally useful but not absolutely accurate, and always pair them with downstream metrics for true performance assessment.
What you should use instead:
CTOR to measure content relevance among people who actually engaged
CTR as a deliverability-adjusted engagement signal
Revenue per email to track direct business impact
Conversion rate to connect email activity to your actual goals
Shifting your reporting dashboard to these metrics gives you a more accurate picture of email marketing performance, especially when comparing campaigns or testing changes over time.
How to Read Benchmarks Without Getting Misled
Industry benchmarks give you a reference point, but they can mislead you if you apply them without context. The average email open rate across all industries is 42.35% as of 2025. Well-segmented campaigns typically achieve 30 to 40%, while triggered emails can reach 40 to 70%. The focus should be on improving open rates through better subject lines, sender reputation, and audience segmentation rather than chasing industry averages.
Your benchmark comparison should always be industry-specific. Technology Services, for example, see an average open rate of 26.80% and a click rate of 2.65%, while Dining and Food Services see a 32.54% open rate but only a 0.81% click rate.
Three rules for using benchmarks well:
Compare yourself to your own historical performance first, before comparing to industry data.
Use your industry vertical's benchmark, not an all-industries average.
Track trends over rolling periods (monthly, quarterly) rather than single campaigns.
Segmentation Analytics: The Biggest Multiplier in Your Data
Segment-level analysis is where email marketing analytics best practices deliver the most measurable returns. When you analyze performance by segment, you move from "what happened" to "what happened with whom," which is a far more useful question.
Segmentation generates 30% higher open rates and 50% more click-throughs compared to unsegmented campaigns. According to DMA, marketers have found a 760% increase in email revenue from segmented campaigns.
What to measure at the segment level:
Engagement rate by segment: Which audiences open and click most consistently?
Conversion rate by segment: Which segments convert at the highest rate, and what content drives that?
Unsubscribe rate by segment: Are certain audiences churning faster? That may indicate poor list hygiene or mismatched expectations.
Revenue per email by segment: Which segments drive the most value per send?
Top-performing marketers go far beyond basic list slicing. They use advanced segmentation strategies that layer demographic, behavioral, and contextual data to build sophisticated audience profiles and deliver highly personalized content across the customer journey, including multidimensional audience targeting that combines demographics, purchase behavior, and engagement history.
A/B testing is not separate from analytics. It is analytics in action. Every test you run generates data that either confirms a hypothesis or tells you something unexpected about your audience.
Personalized subject lines increase open rates by 26%, making subject lines one of the highest-impact variables to test first.
Elements worth testing in order of expected impact:
Subject line (length, tone, personalization, question vs. statement)
From name (brand vs. individual sender)
Send time and day
CTA copy and placement
Email length and content format
Preheader text
AI-powered predictive analytics can predict which email variations are likely to perform better for specific segments, using historical data to make those predictions and making A/B testing more efficient.
One common mistake is ending tests too early. Run tests until there is enough data to confidently declare a winner, typically aiming for a 95% confidence level. Calling a winner after 200 sends on a list of 50,000 will produce unreliable results. Wait for statistical significance before changing your default approach.
Another mistake is testing multiple variables at once. A fundamental strategy is isolating variables to avoid confounding results. Testing subject lines separately from call-to-action buttons ensures clear insights into what drives opens versus clicks.
Automation Analytics: Measuring the Emails That Work While You Sleep
Automated emails outperform broadcast campaigns by almost every measure, yet most teams track them less carefully. That is a missed opportunity.
In 2024, automated emails outperformed scheduled ones by 52% for opens, 332% for clicks, and 2,361% for conversions. The gap is significant enough that your automation reporting should have its own dedicated dashboard, separate from campaign-level reporting.
Key automated sequences to track individually:
Welcome series: Welcome emails achieve an average open rate of 83.6%, making them one of the highest-performing automated email types. Monitor drop-off between email 1 and email 2, and between subsequent steps.
Abandoned cart: Abandoned cart emails achieve an average open rate of 50.5%, a click rate of 6.25%, and a conversion rate of 3.33%, with top-performing brands reaching conversion rates of 7.69%.
Post-purchase: Track repeat purchase rate and average order value lift among recipients.
Re-engagement: Monitor the recovery rate for inactive subscribers and the cost-per-reactivation.
For each sequence, track performance per step, not just per sequence. A welcome series may have strong step-one performance but collapse by step three, which tells you exactly where to focus your optimization.
To build or improve these sequences using data-driven structure, our guide on welcome email sequence best practices covers the proven framework in detail.
Email Marketing Analytics Tools: What to Actually Track Where
Your email service provider (ESP) is the starting point, but it rarely gives you the complete picture. Here is how to use your tools effectively.
Your ESP dashboard should be your first stop for:
Delivery rate, bounce rate (hard and soft), and spam complaint rate
Open rate, CTR, and CTOR at the campaign and automation level
Unsubscribe rate trends by list segment
Google Analytics (or GA4) extends visibility beyond the inbox:
UTM-tagged links let you track email-driven sessions, goal completions, and revenue in your site analytics
Compare email traffic against other channels for true attribution
Identify which emails drive the highest-quality traffic (low bounce rate, high pages per session)
Revenue attribution tools (native in platforms like Klaviyo or Omnisend) connect email clicks to actual purchase data, giving you:
Revenue per email send
Revenue per subscriber
Lifetime value by acquisition source
Brands that use Litmus Email Analytics see a 43% higher ROI than those that don't. Specialized analytics platforms layer on read time, email client breakdown, and device-level data that ESPs do not capture natively, which is useful for diagnosing rendering and engagement issues.
Set up a weekly reporting cadence that covers at least: deliverability health, engagement trends by segment, automation performance by sequence, and revenue attribution. Monthly, add list growth rate, subscriber lifetime value trends, and a comparison against industry benchmarks.
Deliverability Metrics: The Foundation Everything Else Rests On
No analytics practice matters if your emails do not reach the inbox. Deliverability is not a technical afterthought; it is a performance metric.
1 in 6 marketing emails never reach the inbox, getting filtered to spam or blocked outright. 65% of email marketing professionals say email deliverability is becoming more difficult.
Monitor these deliverability-specific indicators:
Inbox placement rate: What percentage of emails actually land in the primary inbox vs. spam or promotions folders
Spam complaint rate: Should stay below 0.1% to maintain sender reputation
Hard bounce rate: Keep below 0.5%; hard bounces signal invalid addresses and damage sender scores
DMARC implementation improves inbox placement by 10 to 20%. Companies properly implementing DMARC see a 10 to 20% improvement in inbox placement rates, directly impacting campaign performance. With Gmail and Yahoo requiring DMARC for senders of 5,000 or more daily emails, authentication has become a deliverability prerequisite.
A clean list is as important as authentication. Suppress unengaged subscribers who have not opened or clicked in 90 to 180 days, depending on your sending frequency. Sending to a disengaged list is a reliable way to trigger spam filters and damage your sender reputation across your active subscribers too.
Frequently Asked Questions
What are the most important email marketing analytics metrics to track?
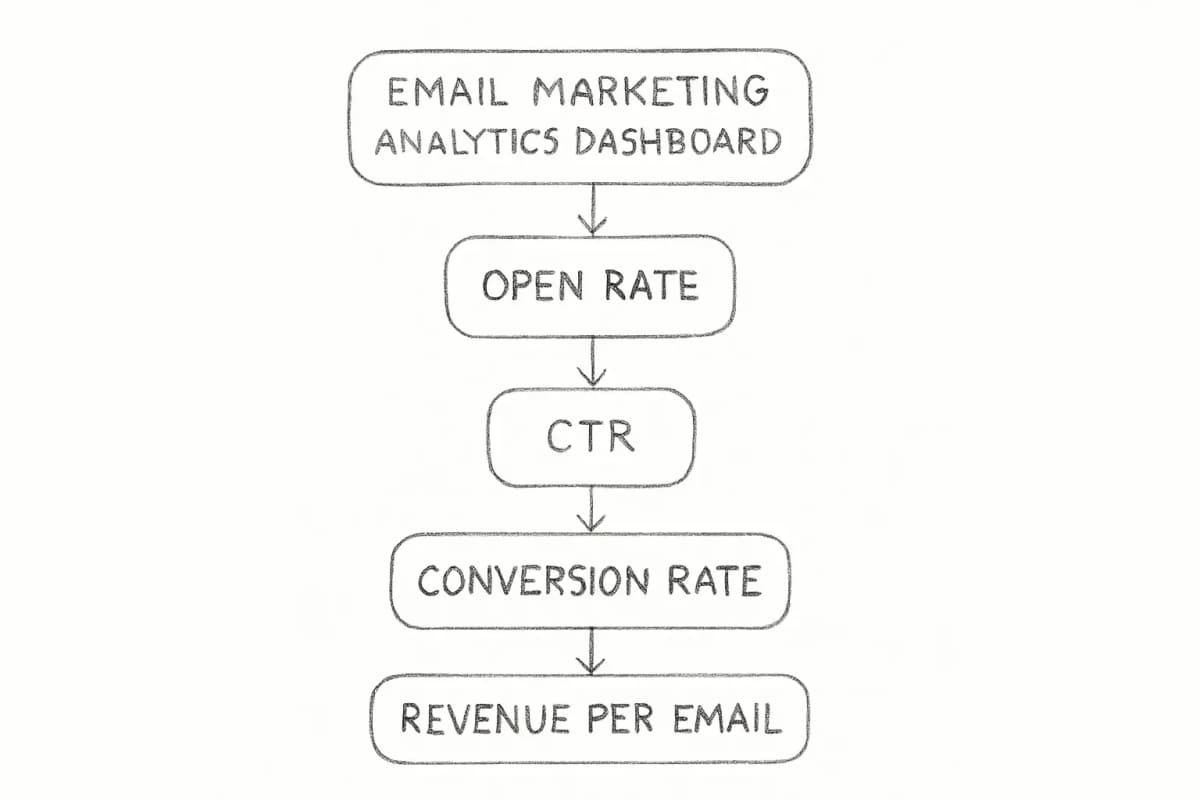
Start with the "big three": open rate, which shows subject line effectiveness; click-through rate, which measures content engagement; and conversion rate, which tracks actual results. From there, add CTOR for content quality measurement, bounce rate for list health, and revenue per email for direct business impact. Given the effect of Apple's MPP on open rate reliability, CTR and conversion rate should be your primary optimization targets in 2025 and beyond.
How often should I review my email marketing performance data?
Email performance analysis should happen at multiple intervals: daily monitoring for delivery and bounce rates to catch immediate issues, weekly reviews of campaign performance and engagement metrics, and monthly deep-dives into customer lifecycle metrics and overall strategy effectiveness. Quarterly, compare your trends against industry benchmarks to calibrate your goals.
Does segmentation really improve email marketing analytics results?
Yes, significantly. According to DMA, marketers have found a 760% increase in email revenue from segmented campaigns. Segmented emails also result in 30% more opens and 50% more click-throughs compared to unsegmented ones. Segmentation also makes your analytics more actionable, because performance differences between segments reveal exactly which audiences, messages, and offers are working.
Are open rates still a reliable metric for email campaign analysis?
Not on their own. Open rates have become less reliable with 64% of Apple Mail users on MPP, which pre-loads images and inflates metrics. Smart marketers now emphasize click-through rates, conversion rates, and revenue per email as primary KPIs. Use open rate as a directional signal for subject line and sender name performance, but validate any conclusions with downstream engagement metrics before acting on them.
No comments yet. Be the first!
Inbox placement rate: What percentage of emails actually land in the primary inbox vs. spam or promotions folders
Spam complaint rate: Should stay below 0.1% to maintain sender reputation
Hard bounce rate: Keep below 0.5%; hard bounces signal invalid addresses and damage sender scores
DMARC implementation improves inbox placement by 10 to 20%. Companies properly implementing DMARC see a 10 to 20% improvement in inbox placement rates, directly impacting campaign performance. With Gmail and Yahoo requiring DMARC for senders of 5,000 or more daily emails, authentication has become a deliverability prerequisite.
A clean list is as important as authentication. Suppress unengaged subscribers who have not opened or clicked in 90 to 180 days, depending on your sending frequency. Sending to a disengaged list is a reliable way to trigger spam filters and damage your sender reputation across your active subscribers too.
Frequently Asked Questions
What are the most important email marketing analytics metrics to track?
Start with the "big three": open rate, which shows subject line effectiveness; click-through rate, which measures content engagement; and conversion rate, which tracks actual results. From there, add CTOR for content quality measurement, bounce rate for list health, and revenue per email for direct business impact. Given the effect of Apple's MPP on open rate reliability, CTR and conversion rate should be your primary optimization targets in 2025 and beyond.
How often should I review my email marketing performance data?
Email performance analysis should happen at multiple intervals: daily monitoring for delivery and bounce rates to catch immediate issues, weekly reviews of campaign performance and engagement metrics, and monthly deep-dives into customer lifecycle metrics and overall strategy effectiveness. Quarterly, compare your trends against industry benchmarks to calibrate your goals.
Does segmentation really improve email marketing analytics results?
Yes, significantly. According to DMA, marketers have found a 760% increase in email revenue from segmented campaigns. Segmented emails also result in 30% more opens and 50% more click-throughs compared to unsegmented ones. Segmentation also makes your analytics more actionable, because performance differences between segments reveal exactly which audiences, messages, and offers are working.
Are open rates still a reliable metric for email campaign analysis?
Not on their own. Open rates have become less reliable with 64% of Apple Mail users on MPP, which pre-loads images and inflates metrics. Smart marketers now emphasize click-through rates, conversion rates, and revenue per email as primary KPIs. Use open rate as a directional signal for subject line and sender name performance, but validate any conclusions with downstream engagement metrics before acting on them.